Interface RS232 and software Viscosoft Basic for data gathering,
temperature probe PT 100, digital dispkay for direct reading of diverse
parameters, under or over range warning signal and 24 months warranty.
Used together with a thermalprinter (Optional) meets requeirements of
the storage data in quality control. Additionaly model V2 has to more speeds
and consequently a wider viscosity range, ni-directional interface RS232 and
optionally, software Viscosoft Plus, for the automated control of viscometer
and the issuing of reological studies.
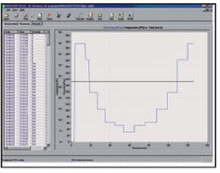
PC BASED SOFTWARE ViscosoftBasic supplied together with model V1 allows to data gathering directly from Viscometer. Measured values are shown in a chart and can be saved in Excel format for posterior evaluation. Use ViscosoftPlus with model V2 and control instrument from your PC. Software permits to program different analysis methods (processes) to obtain graphics and charts including test data. Results obtained can be displayed in graphics. Viscosity plots can be configured vs. different parameters.


 home > 제품소개 > 점도계
)